Visit coache.gse.harvard.edu for more partner resources.
© Copyright 2021, The President & Fellows of Harvard College
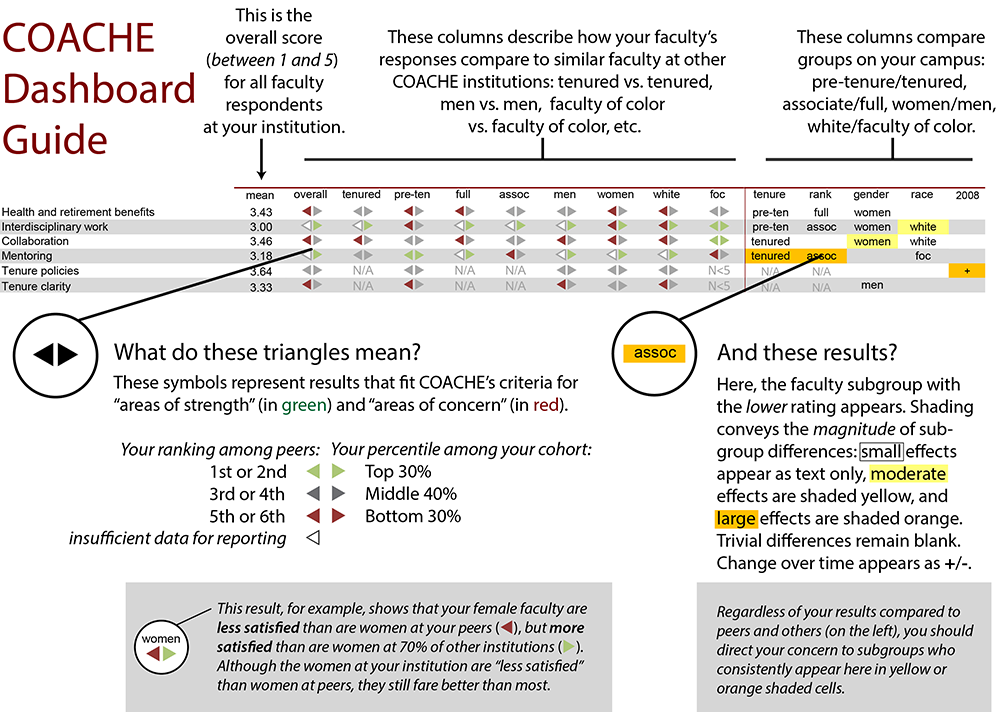
For help understanding this visualization, see
guide video or
guide note
on Benchmarks Dashboard.
To see the full name of subgroup, hover pointer over short name.
|
Your results compared to PEERS ◀
Your results compared to COHORT ▶ |
Areas of strength in GREEN
Areas of concern in RED |
Within campus differences
sm (.1)med. (.3)lrg. (.5) |
|||||||||||||||||||||||||
|
|
mean
|
overall
|
Hum
|
Soc
|
Phy
|
Bio
|
VPA
|
ECM
|
HHE
|
Agr
|
Bus
|
Edu
|
Med
|
Oth
|
Hum vs other
|
Soc vs other
|
Phy vs other
|
Bio vs other
|
VPA vs other
|
ECM vs other
|
HHE vs other
|
Agr vs other
|
Bus vs other
|
Edu vs other
|
Med vs other
|
Oth vs other
|
2018
|
|
Leadership: Senior
|
3.27
|


|


|

|

|
|
|
|
N<5
|
N<5
|
|
|
|
N<5
|
Hum
|
|
other
|
Bio
|
|
ECM
|
N<5
|
N<5
|
other
|
other
|
other
|
N<5
|
-
|
Pres/Chancellor: Pace of decision making |
3.29
|
|
|
|
|
|
|
|
N<5
|
N<5
|
|
|
|
N<5
|
Hum
|
|
other
|
Bio
|
|
ECM
|
N<5
|
N<5
|
other
|
other
|
other
|
N<5
|
-
|
Pres/Chancellor: Stated priorities |
3.29
|
|
|
|
|
|
|
|
N<5
|
N<5
|
|
|
|
N<5
|
Hum
|
|
other
|
Bio
|
|
ECM
|
N<5
|
N<5
|
other
|
other
|
other
|
N<5
|
-
|
Pres/Chancellor: Communication of priorities |
3.25
|
|
|
|
|
|
|
|
N<5
|
N<5
|
|
|
|
N<5
|
Hum
|
|
other
|
Bio
|
|
ECM
|
N<5
|
N<5
|
other
|
other
|
other
|
N<5
|
-
|
CAO: Pace of decision making |
3.30
|
|
|
|
|
|
|
|
N<5
|
N<5
|
|
|
|
N<5
|
Hum
|
|
other
|
|
|
ECM
|
N<5
|
N<5
|
|
|
other
|
N<5
|
-
|
CAO: Stated priorities |
3.24
|
|
|
|
|
|
|
|
N<5
|
N<5
|
|
|
|
N<5
|
Hum
|
|
other
|
|
|
ECM
|
N<5
|
N<5
|
|
other
|
other
|
N<5
|
-
|
CAO: Communication of priorities |
3.27
|
|
|
|
|
|
|
|
N<5
|
N<5
|
|
|
|
N<5
|
Hum
|
|
other
|
|
other
|
ECM
|
N<5
|
N<5
|
|
other
|
other
|
N<5
|
-
|
CAO: Ensuring faculty input |
N/A
|
N/A
|
N/A
|
N/A
|
N/A
|
N/A
|
N/A
|
N/A
|
N/A
|
N/A
|
N/A
|
N/A
|
N/A
|
N/A
|
N/A
|
N/A
|
N/A
|
N/A
|
N/A
|
N/A
|
N/A
|
N/A
|
N/A
|
N/A
|
N/A
|
N/A
|
N/A
|
|
Leadership: Divisional
|
3.40
|
|
|
|
|
|
|
|
N<5
|
N<5
|
|
|
|
N<5
|
Hum
|
Soc
|
other
|
|
other
|
|
N<5
|
N<5
|
other
|
other
|
|
N<5
|
|
Dean: Pace of decision making |
3.49
|
|
|
|
|
|
|
|
N<5
|
N<5
|
|
|
|
N<5
|
Hum
|
Soc
|
other
|
|
other
|
|
N<5
|
N<5
|
other
|
other
|
|
N<5
|
|
Dean: Stated priorities |
3.45
|
|
|
|
|
|
|
|
N<5
|
N<5
|
|
|
|
N<5
|
Hum
|
Soc
|
other
|
|
other
|
|
N<5
|
N<5
|
other
|
other
|
|
N<5
|
|
Dean: Communication of priorities |
3.43
|
|
|
|
|
|
|
|
N<5
|
N<5
|
|
|
|
N<5
|
Hum
|
Soc
|
other
|
|
other
|
|
N<5
|
N<5
|
other
|
other
|
|
N<5
|
|
Dean: Ensuring faculty input |
3.23
|
|
|
|
|
|
|
|
N<5
|
N<5
|
|
|
|
N<5
|
Hum
|
Soc
|
other
|
Bio
|
other
|
|
N<5
|
N<5
|
other
|
other
|
other
|
N<5
|
|
|
Leadership: Departmental
|
3.78
|
|
|
|
|
|
|
|
N<5
|
N<5
|
|
|
|
N<5
|
|
Soc
|
other
|
|
other
|
|
N<5
|
N<5
|
other
|
|
|
N<5
|
+
|
Head/Chair: Pace of decision making |
3.75
|
|
|
|
|
|
|
|
N<5
|
N<5
|
|
|
|
N<5
|
|
Soc
|
other
|
|
|
|
N<5
|
N<5
|
other
|
|
|
N<5
|
|
Head/Chair: Stated priorities |
3.67
|
|
|
|
|
|
|
|
N<5
|
N<5
|
|
|
|
N<5
|
|
Soc
|
other
|
|
other
|
ECM
|
N<5
|
N<5
|
other
|
|
|
N<5
|
+
|
Head/Chair: Communication of priorities |
3.70
|
|
|
|
|
|
|
|
N<5
|
N<5
|
|
|
|
N<5
|
|
Soc
|
other
|
|
other
|
|
N<5
|
N<5
|
other
|
|
Med
|
N<5
|
|
Head/Chair: Ensuring faculty input |
3.75
|
|
|
|
|
|
|
|
N<5
|
N<5
|
|
|
|
N<5
|
|
Soc
|
other
|
|
other
|
ECM
|
N<5
|
N<5
|
other
|
|
|
N<5
|
+
|
Head/Chair: Fairness in evaluating work |
4.05
|
|
|
|
|
|
|
|
N<5
|
N<5
|
|
|
|
N<5
|
|
Soc
|
other
|
|
|
other
|
N<5
|
N<5
|
|
|
|
N<5
|
+
|
|
Leadership: Faculty
|
3.42
|
|
|
|
|
|
|
|
N<5
|
N<5
|
|
|
|
N<5
|
other
|
Soc
|
other
|
|
VPA
|
ECM
|
N<5
|
N<5
|
|
other
|
|
N<5
|
+
|
Faculty leaders: Pace of decision making |
3.32
|
|
|
|
|
|
|
|
N<5
|
N<5
|
|
|
|
N<5
|
other
|
Soc
|
other
|
|
|
ECM
|
N<5
|
N<5
|
Bus
|
other
|
|
N<5
|
+
|
Faculty leaders: Stated priorities |
3.45
|
|
|
|
|
|
|
|
N<5
|
N<5
|
|
|
|
N<5
|
other
|
Soc
|
other
|
other
|
|
ECM
|
N<5
|
N<5
|
|
other
|
|
N<5
|
+
|
Faculty leaders: Communication of priorities |
3.44
|
|
|
|
|
|
|
|
N<5
|
N<5
|
|
|
|
N<5
|
other
|
Soc
|
other
|
|
VPA
|
ECM
|
N<5
|
N<5
|
|
other
|
|
N<5
|
|
Faculty leaders: Ensuring faculty input |
3.50
|
|
|
|
|
|
|
|
N<5
|
N<5
|
|
|
|
N<5
|
|
|
other
|
|
VPA
|
|
N<5
|
N<5
|
|
other
|
|
N<5
|
+
|
|
Related Survey Items
|
--
|
--
|
--
|
--
|
--
|
--
|
--
|
--
|
--
|
--
|
--
|
--
|
--
|
--
|
--
|
--
|
--
|
--
|
--
|
--
|
--
|
--
|
--
|
--
|
--
|
--
|
--
|
Priorities are stated consistently |
3.02
|
|
|
|
|
|
|
|
N<5
|
N<5
|
|
|
|
N<5
|
Hum
|
Soc
|
other
|
Bio
|
|
|
N<5
|
N<5
|
other
|
other
|
other
|
N<5
|
-
|
Priorities are acted on consistently |
2.81
|
|
|
|
|
|
|
|
N<5
|
N<5
|
|
|
|
N<5
|
Hum
|
Soc
|
other
|
|
|
|
N<5
|
N<5
|
other
|
other
|
other
|
N<5
|
-
|
Changed priorities negatively affect my work |
2.75
|
|
|
|
|
|
|
|
N<5
|
N<5
|
|
|
|
N<5
|
Hum
|
Soc
|
other
|
|
VPA
|
ECM
|
N<5
|
N<5
|
other
|
other
|
other
|
N<5
|
-
|
CAO: Support in adapting to change |
N/A
|
N/A
|
N/A
|
N/A
|
N/A
|
N/A
|
N/A
|
N/A
|
N/A
|
N/A
|
N/A
|
N/A
|
N/A
|
N/A
|
N/A
|
N/A
|
N/A
|
N/A
|
N/A
|
N/A
|
N/A
|
N/A
|
N/A
|
N/A
|
N/A
|
N/A
|
N/A
|
Visible leadership for support of diversity |
3.90
|
|
|
|
|
|
|
|
N<5
|
N<5
|
|
|
|
N<5
|
Hum
|
Soc
|
other
|
Bio
|
|
ECM
|
N<5
|
N<5
|
|
other
|
other
|
N<5
|
|